Read the site overview
The overview is the first page of a tracking site. It shows the last 7 days of calls and how they compare with the 7 days before.
Open the overview
In the Enfonica Console, open the tracking site and click Overview.
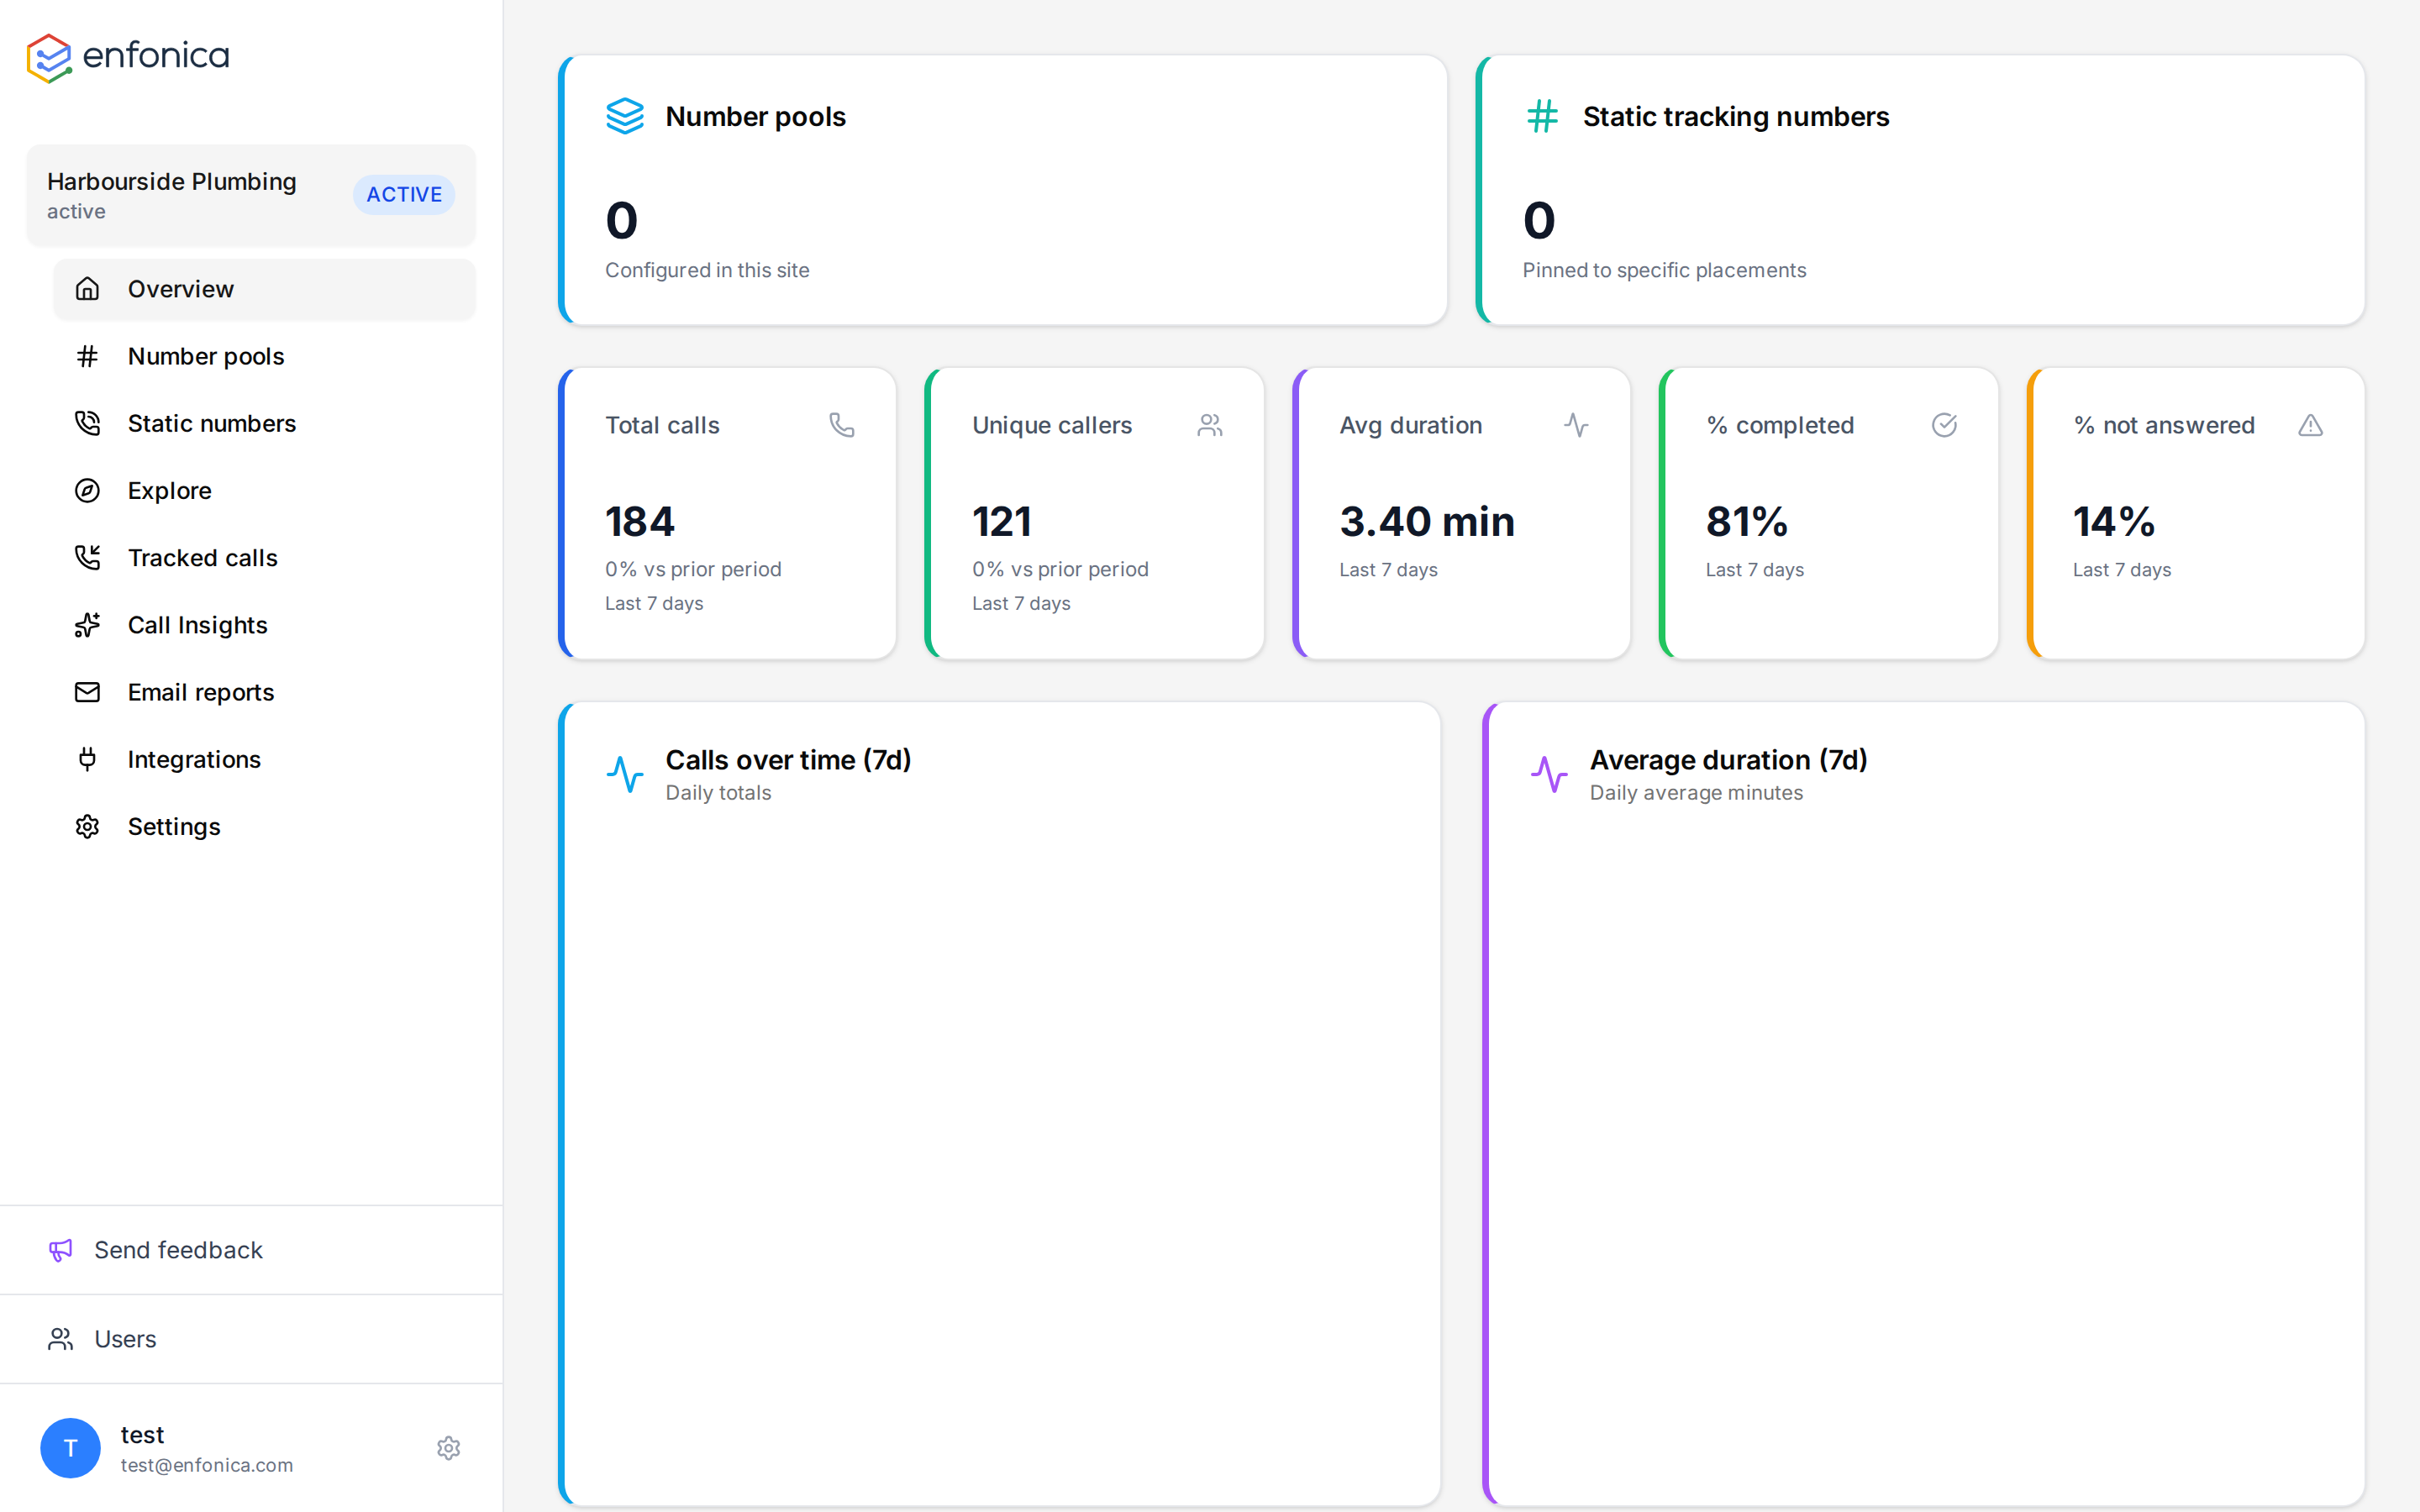
What it shows
- Number pools and Static tracking numbers: how many of each the site has, with links to manage them.
- Total calls: all calls to the site's tracking numbers in the last 7 days, with the change from the previous 7 days.
- Unique callers: distinct caller numbers.
- Avg duration: the average length of connected calls, in minutes.
- % completed: the share of calls that were answered at the destination.
- % not answered: the share of calls where nobody picked up, including callers who hung up in a menu or left a voicemail.
- Calls over time: daily totals for the last 7 days.
- Average duration: daily average call length.
- Weekly overview: totals against answered calls.
- Top sources: sources ranked by call volume.
Periods are calculated in Australian Eastern Standard Time.
If the site is paused, a banner says so and metrics may lag until it is resumed.
Use it
- A falling % completed means the business is missing calls. See Business hours, failover and voicemail with Flow.
- Top sources is the quickest answer to "where do our calls come from". For more detail, use Explore.
- For a client-ready summary on a schedule, use email reports.