Build custom reports with Explore
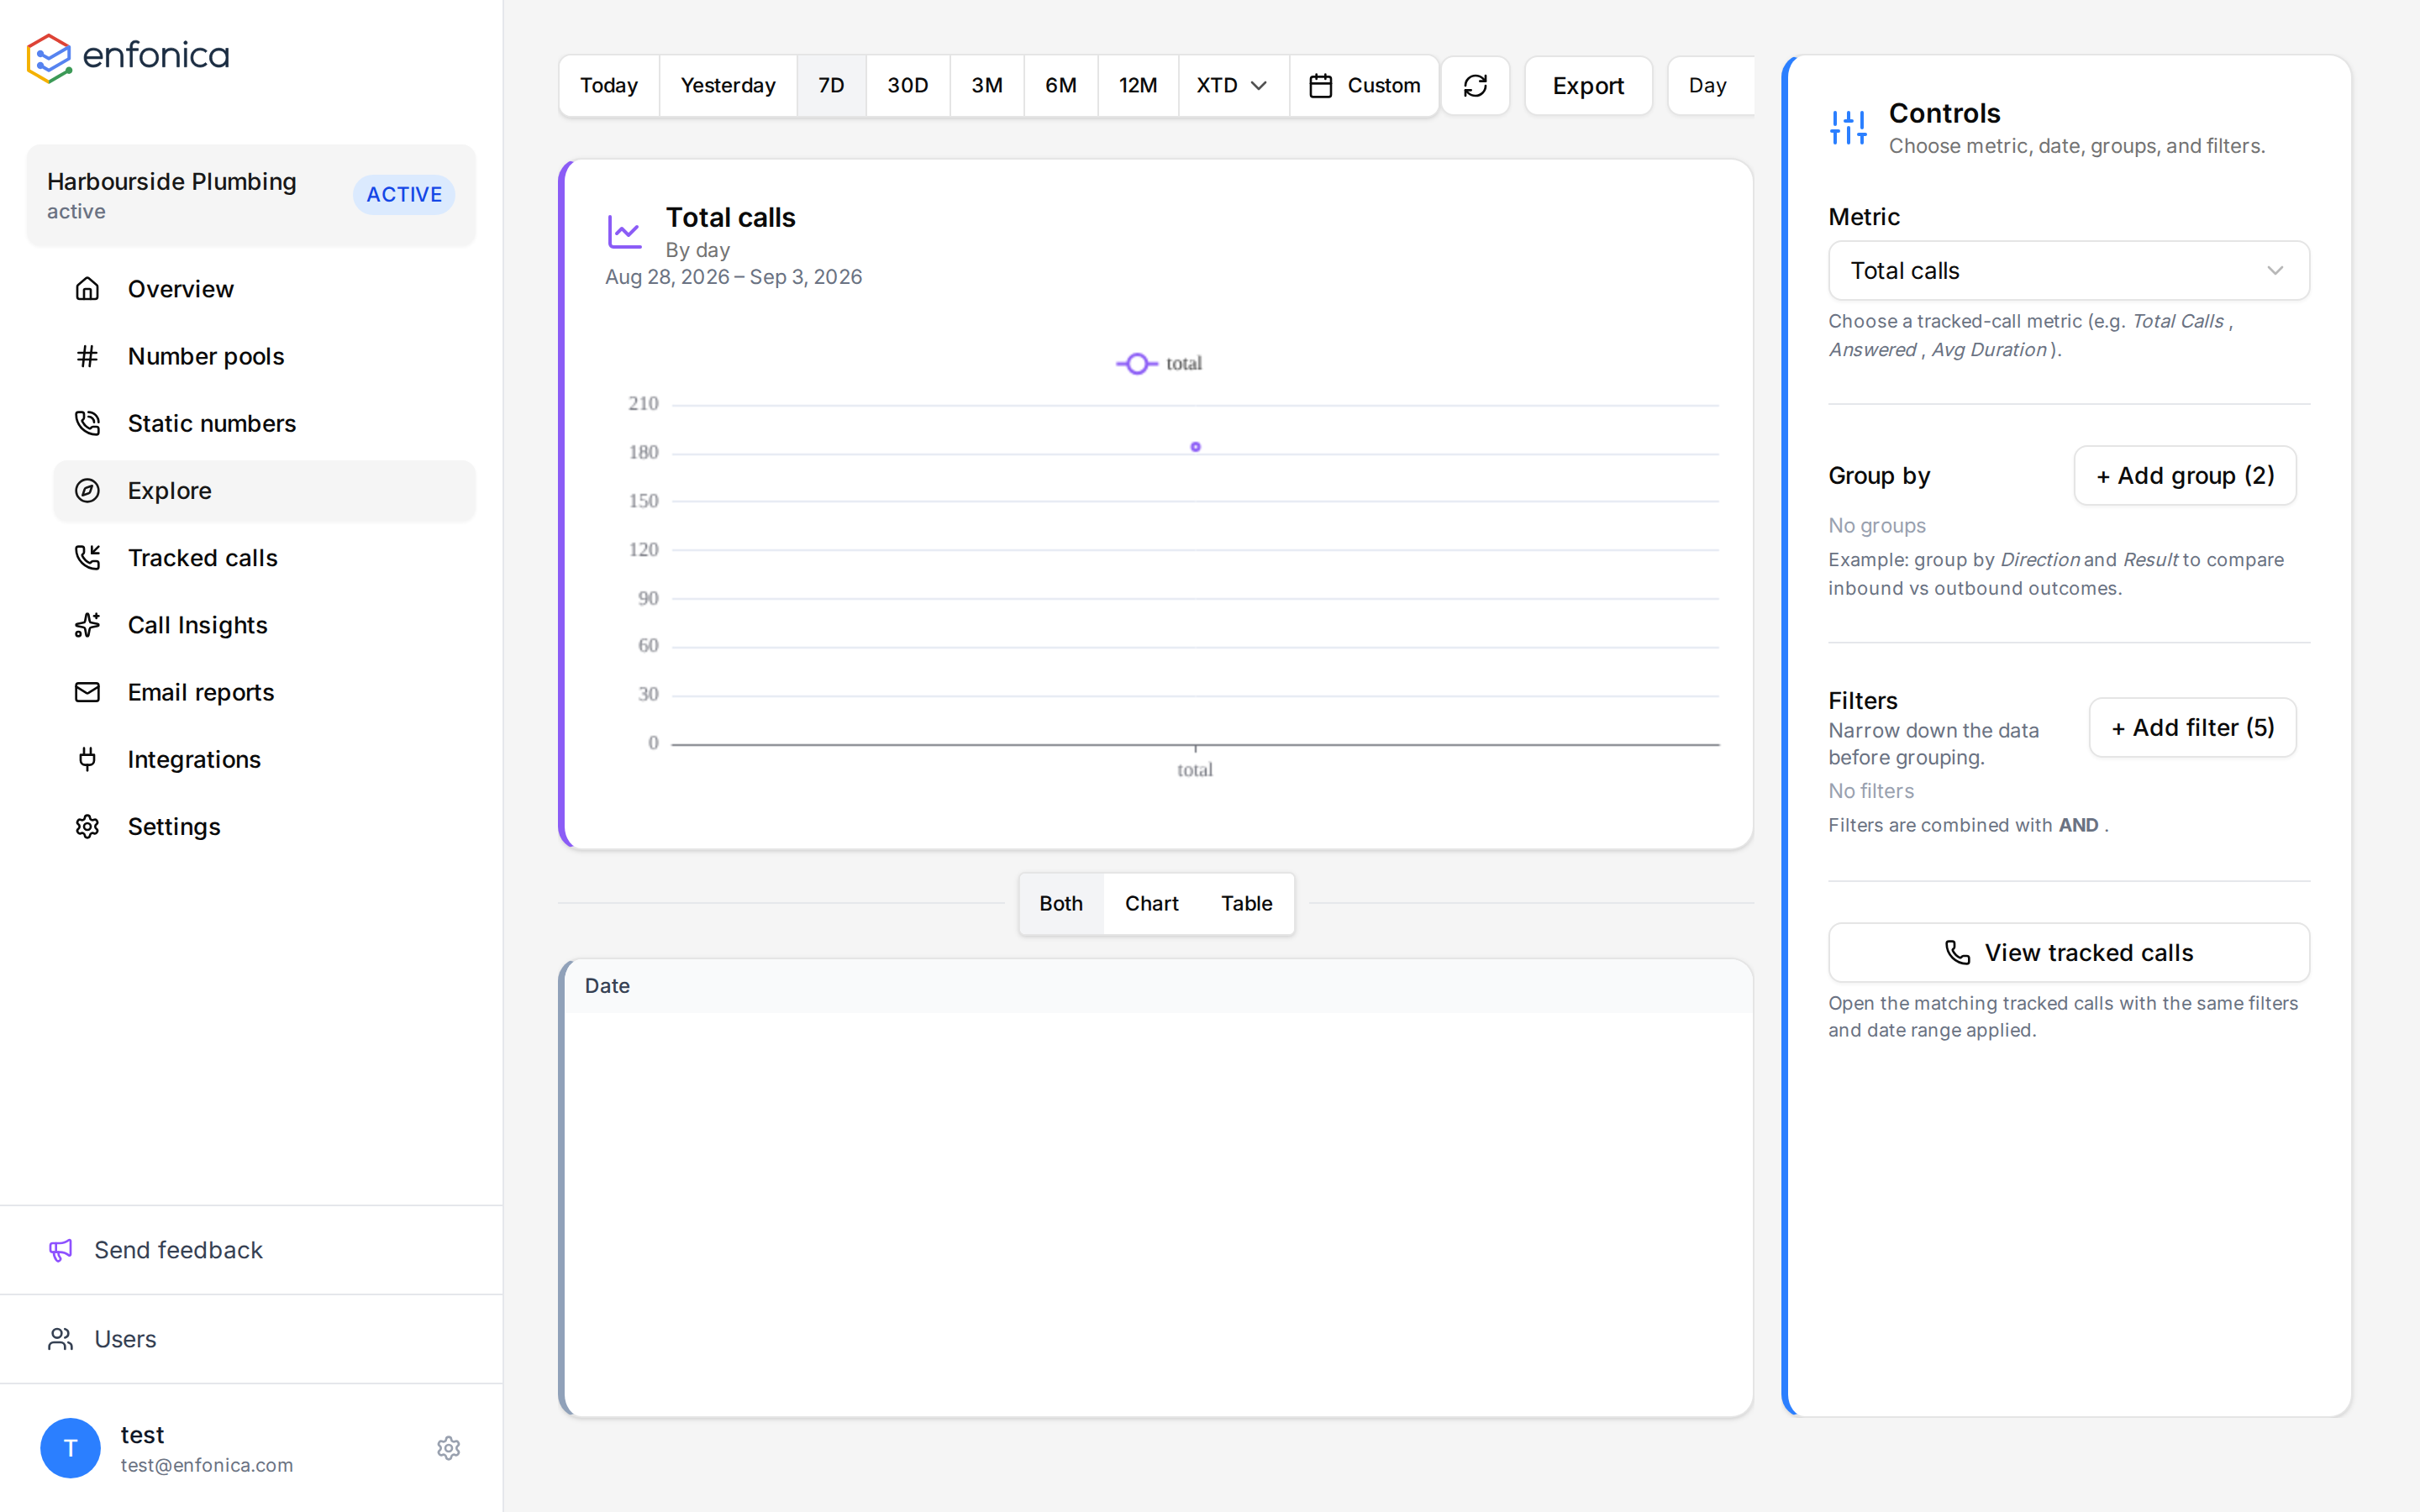
Explore is the report builder for a tracking site. Choose a metric, break it down by one or more dimensions, filter it, and view the result as a chart or a table.
Build a report
- In the Enfonica Console, open the tracking site and click Explore.
- Set the date range in the toolbar.
- Under Controls, choose a Metric, such as total calls, answered calls or average duration.
- Click Add group and choose a dimension to break the metric down by, such as source, campaign or landing page. Add a second group to compare two dimensions.
- Click Add filter to limit the data before it is grouped. Choose a field, an operator and a value, for example outcome equals completed, or the called number starts with a prefix.
- Set the Date Unit to Day to see a trend over time, or leave it as None for totals.
- Choose a chart type and switch between Both, Chart and Table.
The report updates as you change the controls. Click Refresh to load calls that ended since the report was built.
Examples
| Question | Metric | Group by | Filter |
|---|---|---|---|
| Which campaigns drive calls? | Total calls | Campaign | Outcome = completed |
| Which landing pages make the phone ring? | Total calls | Landing page | |
| How many calls does each tracking number get? | Total calls | Tracking number | |
| Is the answer rate getting worse? | % not answered | None, with Date Unit set to Day | |
| How many qualified calls came from paid search? | Total calls | Source | Label = Qualified, Medium = cpc |
| What share of calls come from phones? | Total calls | Device Category | (none) |
Export
Click Export to download the table as a CSV file.
Limits
The date unit is currently Day. Hour, week and month grouping aren't available yet.